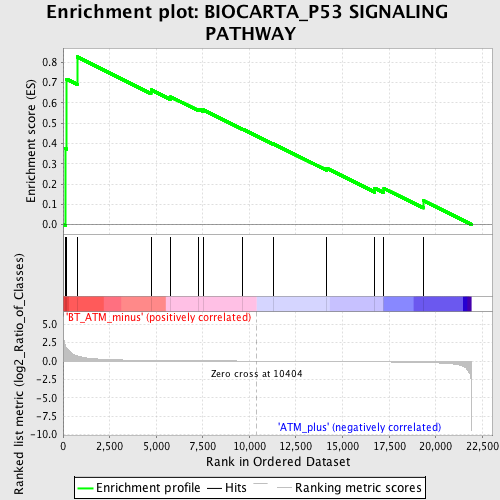
Profile of the Running ES Score & Positions of GeneSet Members on the Rank Ordered List
| Dataset | Set_02_BT_ATM_minus_versus_ATM_plus.phenotype_BT_ATM_minus_versus_ATM_plus.cls #BT_ATM_minus_versus_ATM_plus.phenotype_BT_ATM_minus_versus_ATM_plus.cls #BT_ATM_minus_versus_ATM_plus_repos |
| Phenotype | phenotype_BT_ATM_minus_versus_ATM_plus.cls#BT_ATM_minus_versus_ATM_plus_repos |
| Upregulated in class | BT_ATM_minus |
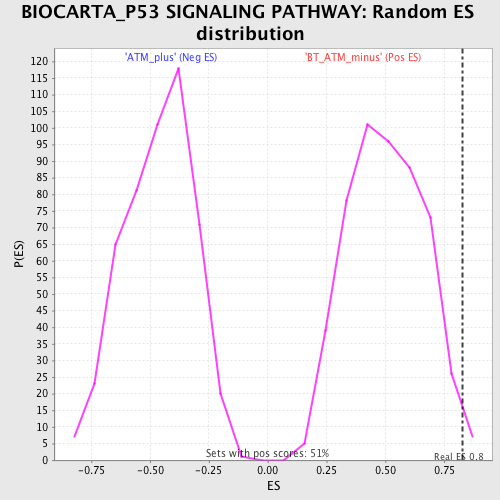
| GeneSet | BIOCARTA_P53 SIGNALING PATHWAY |
| Enrichment Score (ES) | 0.82619876 |
| Normalized Enrichment Score (NES) | 1.6394129 |
| Nominal p-value | 0.0116959065 |
| FDR q-value | 0.6579558 |
| FWER p-Value | 0.98 |
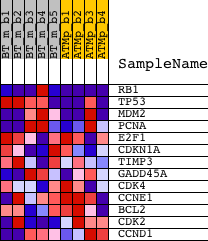
| PROBE | DESCRIPTION (from dataset) | GENE SYMBOL | GENE_TITLE | RANK IN GENE LIST | RANK METRIC SCORE | RUNNING ES | CORE ENRICHMENT | |
|---|---|---|---|---|---|---|---|---|
| 1 | RB1 | 1417850_at 1441494_at 1444400_at 1444454_at 1457447_at | 142 | 1.947 | 0.3733 | Yes | ||
| 2 | TP53 | 1426538_a_at 1427739_a_at 1438808_at 1457623_x_at 1459780_at 1459781_x_at | 192 | 1.767 | 0.7158 | Yes | ||
| 3 | MDM2 | 1423605_a_at 1427718_a_at 1457929_at | 754 | 0.697 | 0.8262 | Yes | ||
| 4 | PCNA | 1417947_at | 4721 | 0.094 | 0.6636 | No | ||
| 5 | E2F1 | 1417878_at 1431875_a_at 1447840_x_at | 5785 | 0.070 | 0.6288 | No | ||
| 6 | CDKN1A | 1421679_a_at 1424638_at | 7277 | 0.043 | 0.5692 | No | ||
| 7 | TIMP3 | 1419088_at 1419089_at 1449334_at 1449335_at | 7541 | 0.039 | 0.5649 | No | ||
| 8 | GADD45A | 1449519_at | 9649 | 0.010 | 0.4708 | No | ||
| 9 | CDK4 | 1422441_x_at | 11275 | -0.011 | 0.3989 | No | ||
| 10 | CCNE1 | 1416492_at 1441910_x_at | 14140 | -0.051 | 0.2781 | No | ||
| 11 | BCL2 | 1422938_at 1427818_at 1437122_at 1440770_at 1443837_x_at 1457687_at | 16732 | -0.098 | 0.1791 | No | ||
| 12 | CDK2 | 1416873_a_at 1447617_at | 17227 | -0.111 | 0.1782 | No | ||
| 13 | CCND1 | 1417419_at 1417420_at 1448698_at | 19337 | -0.187 | 0.1185 | No |